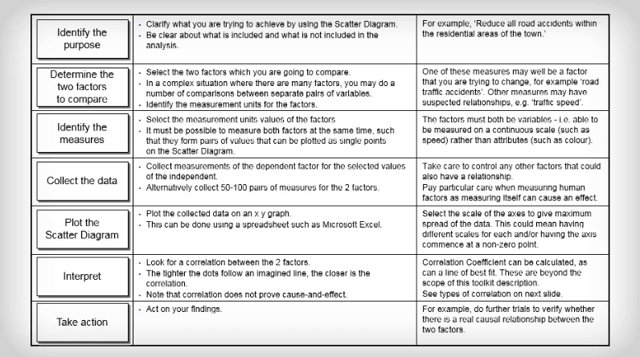
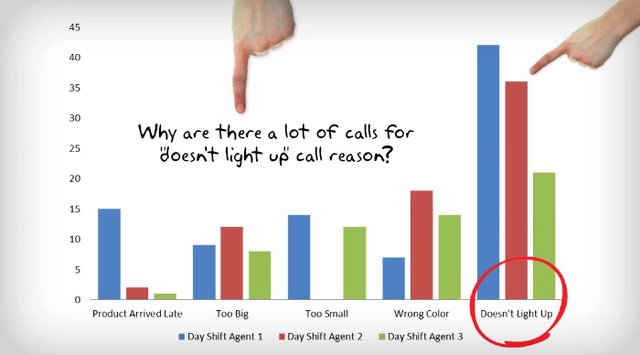
Continuing our series on the 7 quality tools, today we'll discuss the Scatter Plot. The 4:27 minute video explains the Scatterplot in Six Sigma
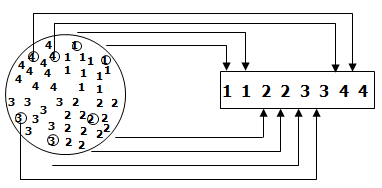
Data Types in Six Sigma
In the introduction to the Measure Phase, I mentioned that our focus is in the practical use of data. In that spirit, by the end of this module on
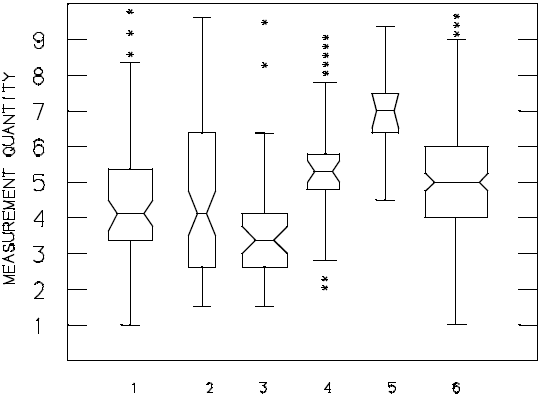
Graphical Representation of Data
Graphical methods includes boxplots, stem and leaf plots, scatter diagrams, pattern and trend analysis, histograms, normal probability distributions
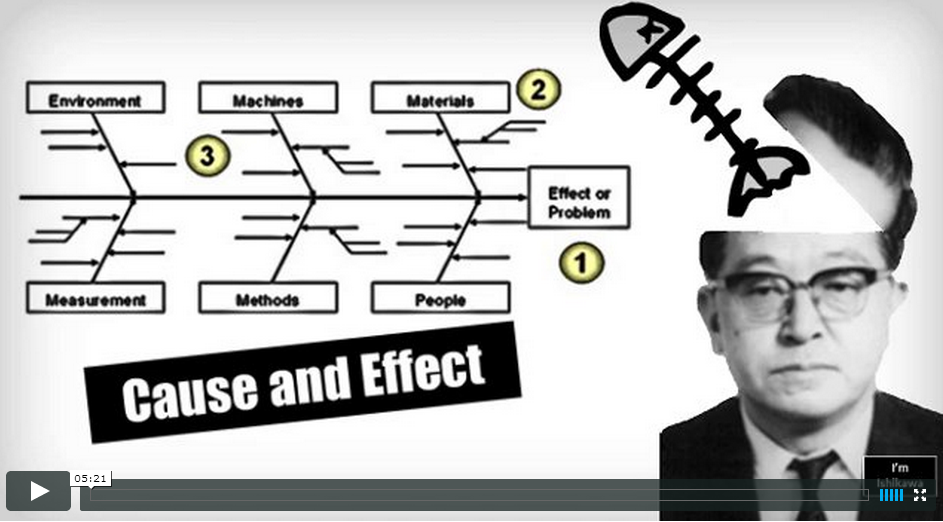
Cause and Effect Diagram
This video on the Cause and Effect Diagram is part of the 7 Quality Tools series. In this 5:26 minute video, you will learn the following: What is
Histogram – 7 QC Tools for Graphical Analysis
Histogram - 7 QC Tools for Graphical Analysis is one of the most simplest and helpful tools used in Lean and Six Sigma. It is one of the 7 QC
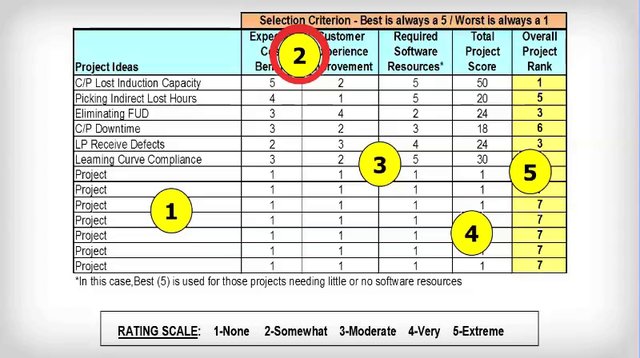
Project Selection Matrix
In this short 2:51 minute video, you'll learn how to apply a simple yet effective method for project selection within the context of a DMAIC Six Sigma

The Project Charter in Six Sigma
The Project Charter in Six Sigma DMAIC Project is one of the most important artifacts that will keep the team on the same page, stakeholders aware and
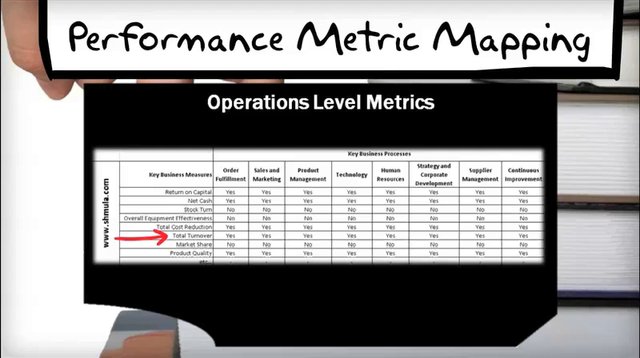
Business Needs Assessment
In this 6:46 minute video entitled "Business Needs Assessment", we introduce several ways to identify the needs of a business and demonstrate how to
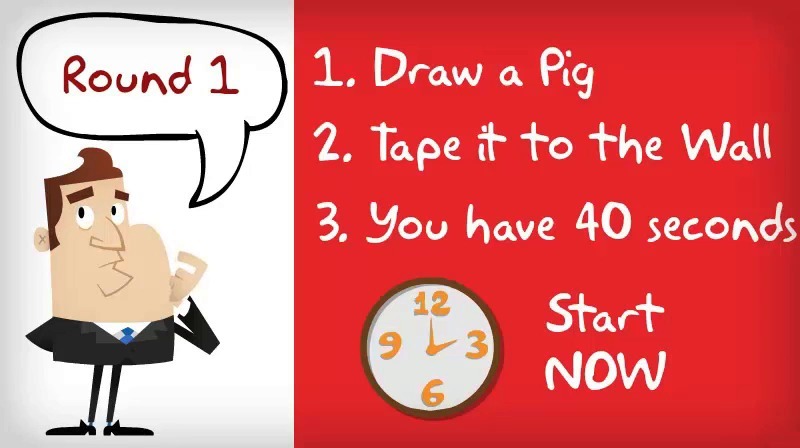
Standard Pig Game
Standard Work is a foundation of Lean. Yet, it's a concept that's not understood well and, even worse, is often ignored by most companies that profess