
Part 1 explained the Red Bead Experiment. In Part 2, I'll share the a video tutorial on the Red Bead Experiment - part 2 of that video series. Before

Red Bead Experiment: Part 1
The Red Bead Experiment is a metaphor for problems, where the red beads represent "bad" and white represent "good". It is a teaching tool mostly used
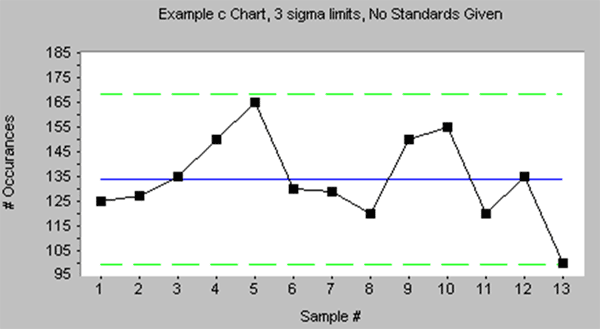
Control Chart Excel Download Template
This post will briefly explain and answer "What is a Control Chart?" At the bottom of the page, you can grab a series of Control Chart Excel
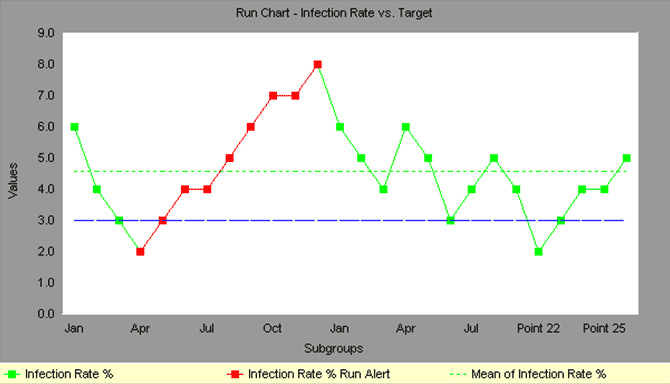
Run Chart
Read below to learn more about Run Charts, or head over here to download a free run chart template that you can use today. Run Charts, also known
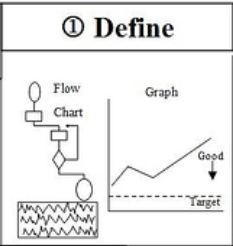
The DEFINE Phase
The first phase in the Six Sigma Define-Measure-Analyze-Improve-Control (DMAIC) Methodology is Define. In this Premium HD Video, we learn the key
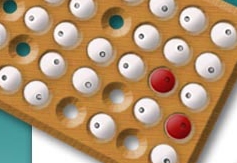
Red Bead Experiment Instructions
This post shows some basic instructions on how to conduct the Red Bead Experiment or Red Bead Game. The Red Bead Experiment can be conducted with a
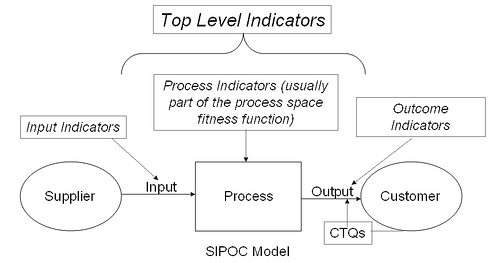
Suppliers, Inputs, Process, Output, Customers (SIPOC Diagram)
A SIPOC is a high level process map that includes Suppliers, Inputs, Process, Output, and Customers. The video below explains SIPOC and shows several
Stakeholder Analysis
In this short 2:47 minute video, you will learn why Stakeholder Analysis is important, how to conduct a stakeholder analysis, and develop an effective

Voice of the Customer Example and Explanation
The Voice of the Customer is a process used to capture the requirements or feedback from the customer (internal or external) to provide them with a