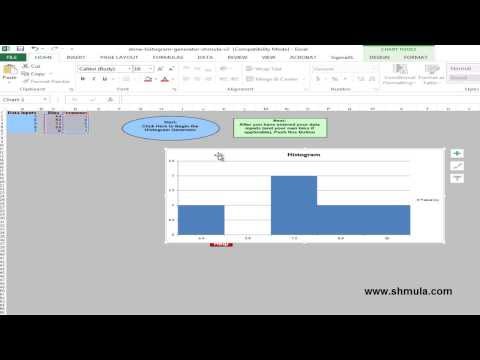
The Histogram is one of the 7 Quality Tools. In this article, we provide a link where you can get a Histogram Template Download - but it's no ordinary
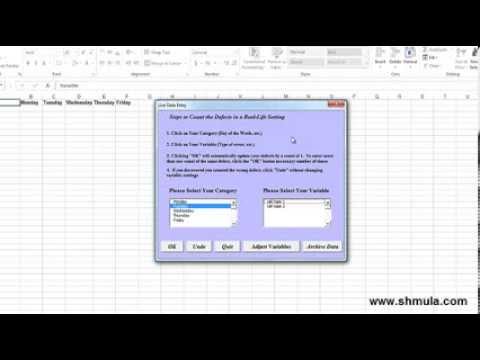
Checksheet Template Download
Today I'm giving away a really helpful tool that can save you time and money in your data collection efforts. Today I'm giving away a Checksheet
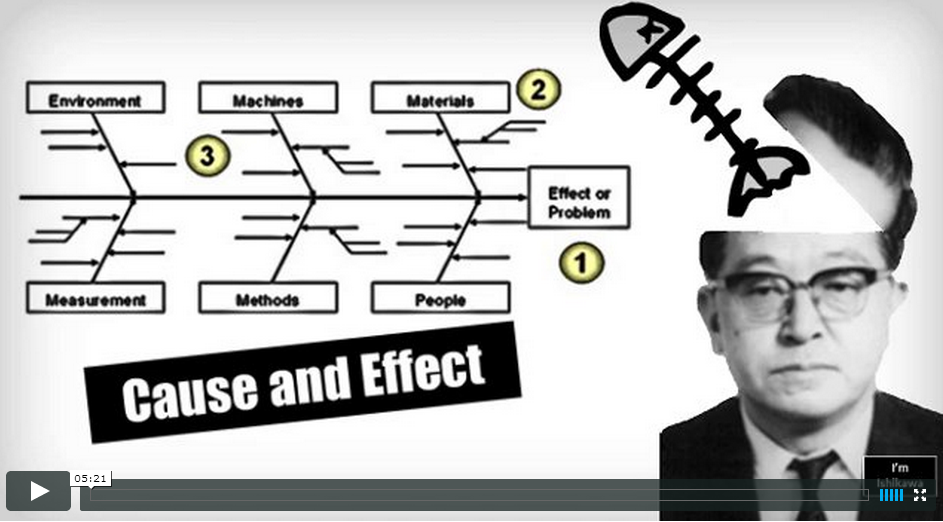
Cause and Effect Diagram
This video on the Cause and Effect Diagram is part of the 7 Quality Tools series. In this 5:26 minute video, you will learn the following: What is
Lean and Six Sigma Is Not For Lovers. Until Now.
You are a murderer of Love; A Reject of Romance - have you ever been accused of being either of those before? Yeah, me too. Lean and Six Sigma is NOT
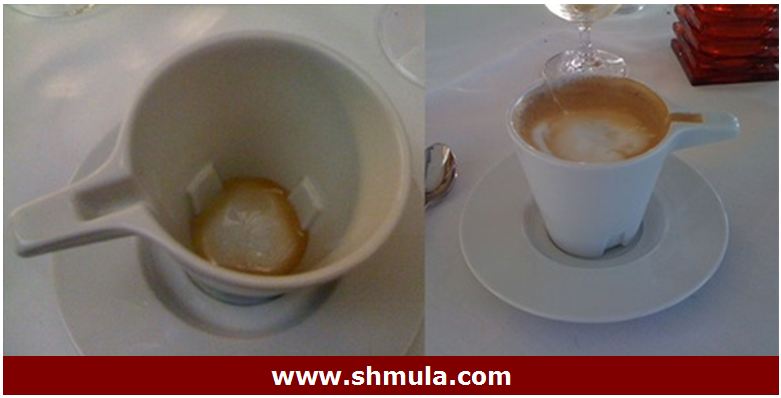
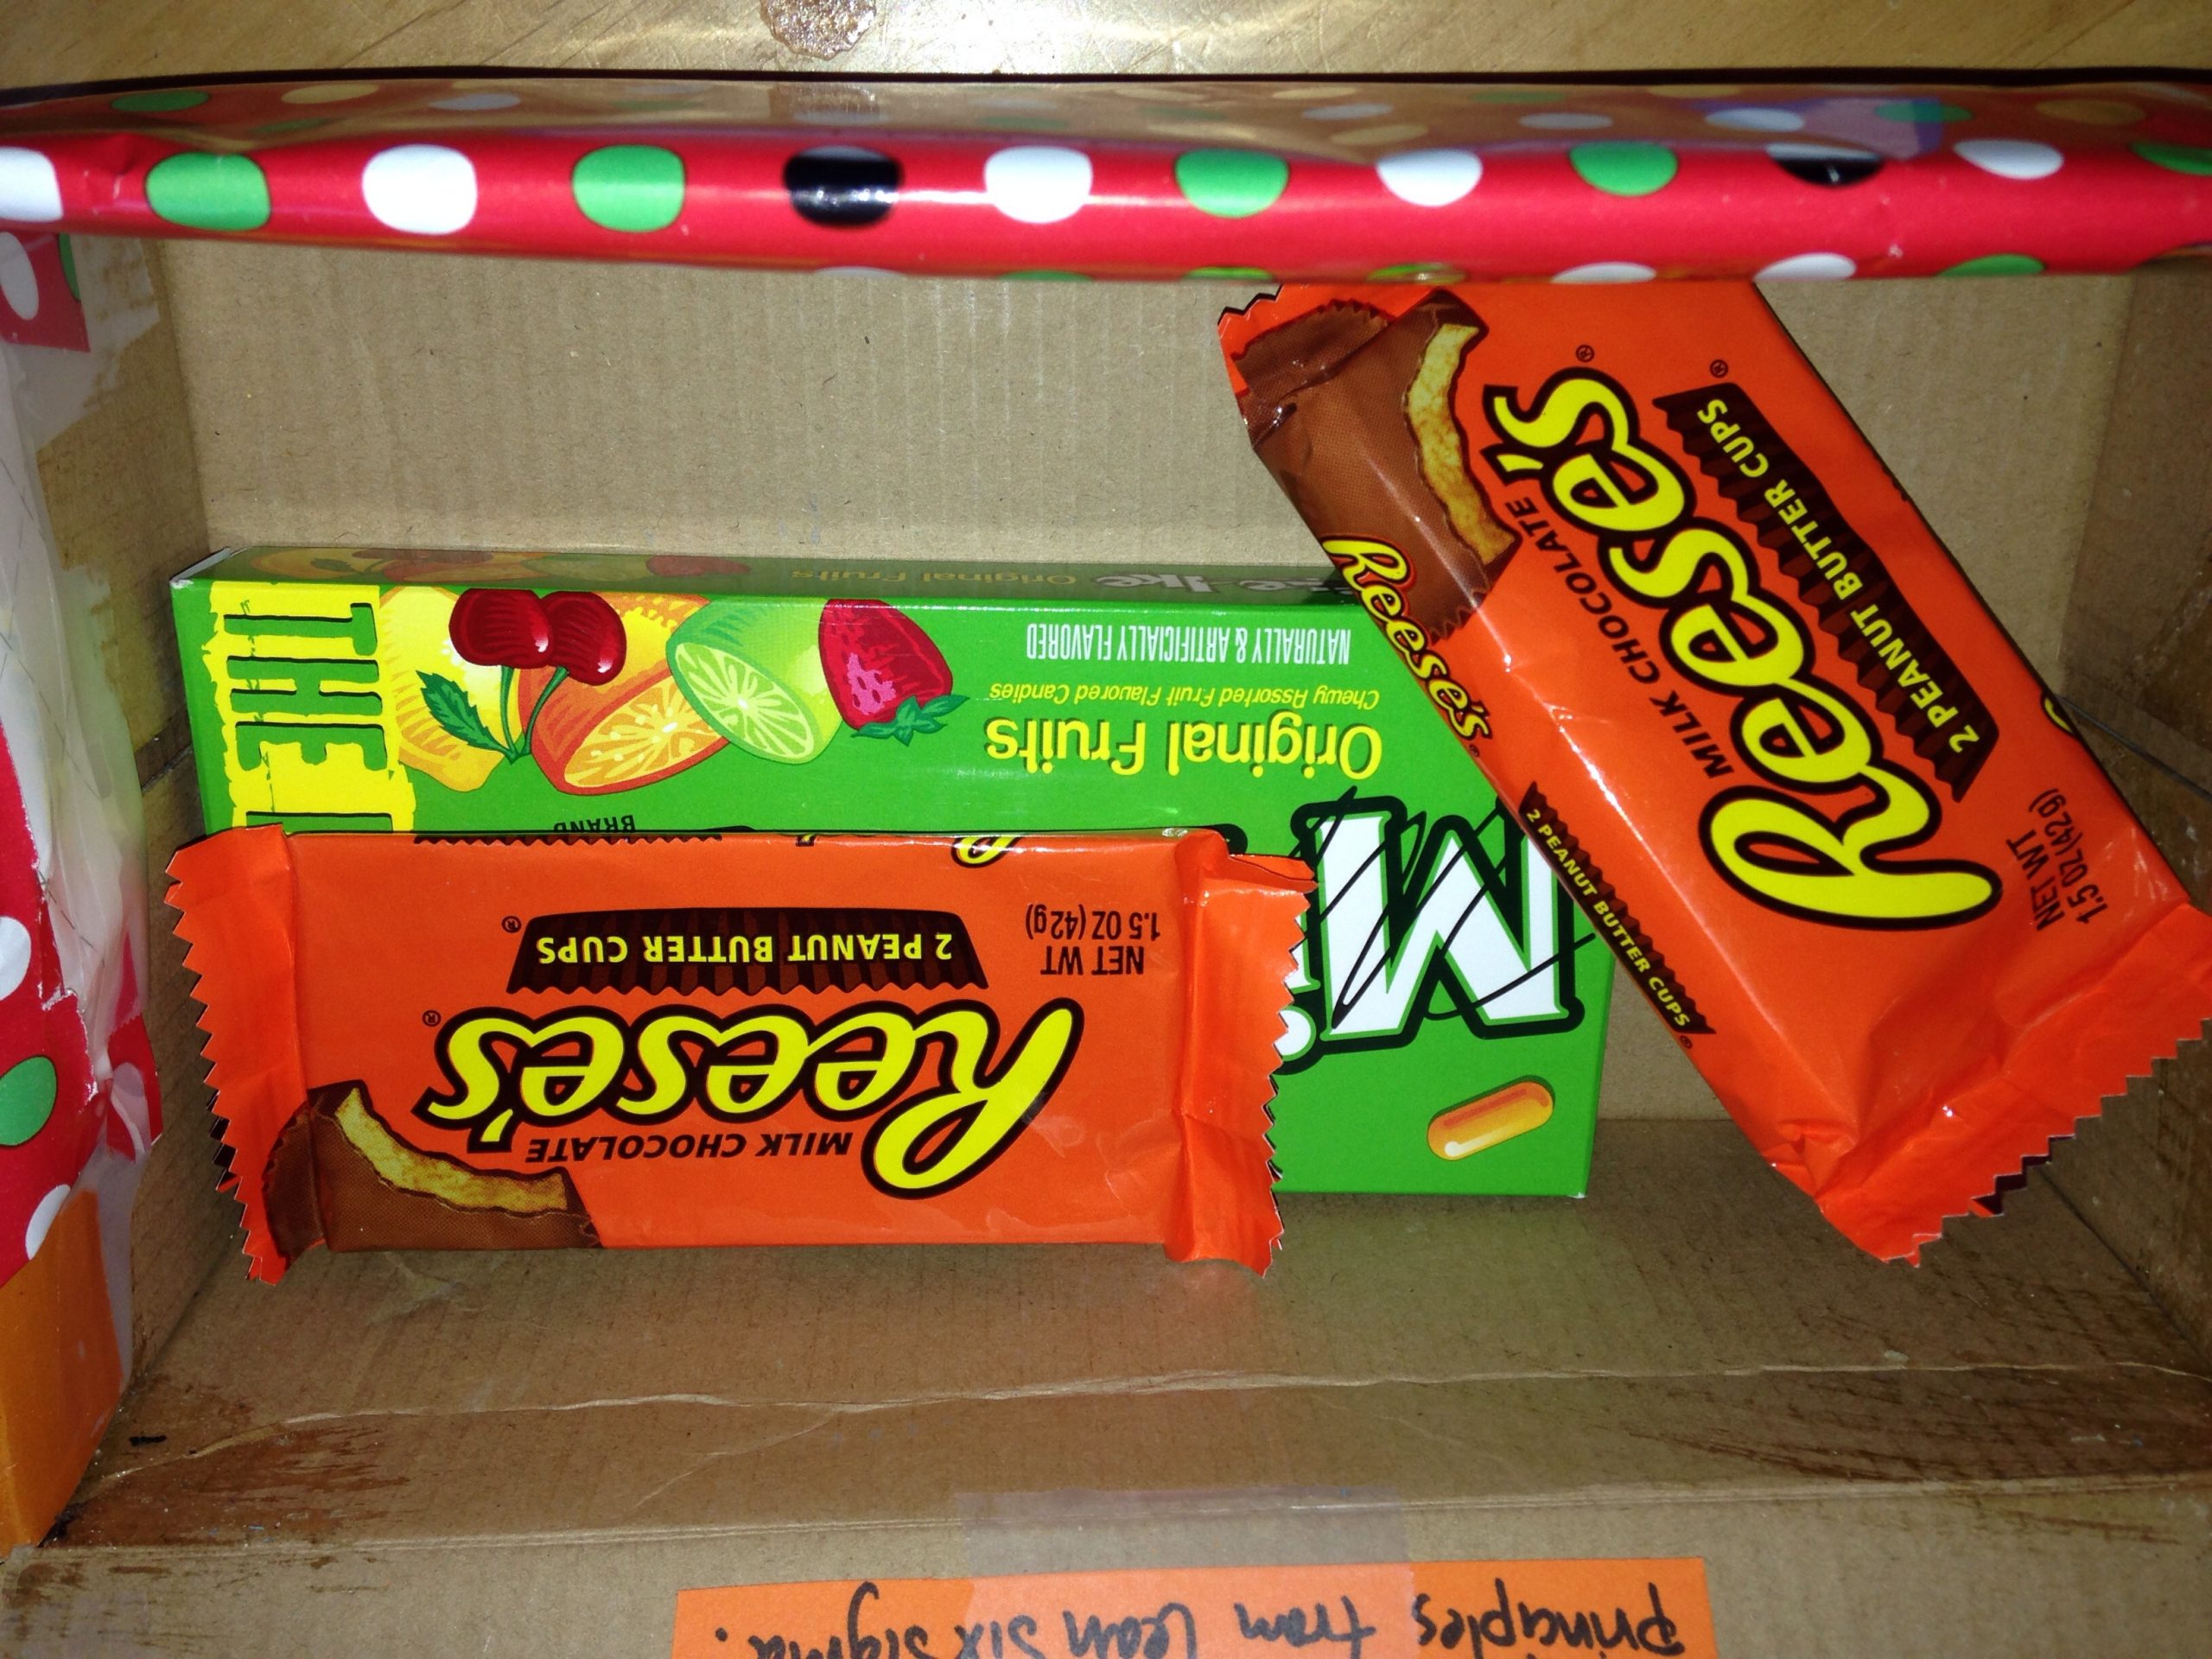
What a Coffee Cup Taught Me About Poka Yoke and Human Errors
One can learn a lot about Poka Yoke and Human Errors. This is a story about what a coffee cup taught me about how poor design in our products and
Histogram – 7 QC Tools for Graphical Analysis
Histogram - 7 QC Tools for Graphical Analysis is one of the most simplest and helpful tools used in Lean and Six Sigma. It is one of the 7 QC
What Does It Mean to Be Lean? An Infographic Explanation
"What does it mean to be Lean Six Sigma?" is a common question asked by curious folks interested in Lean or Six Sigma, but without first hand

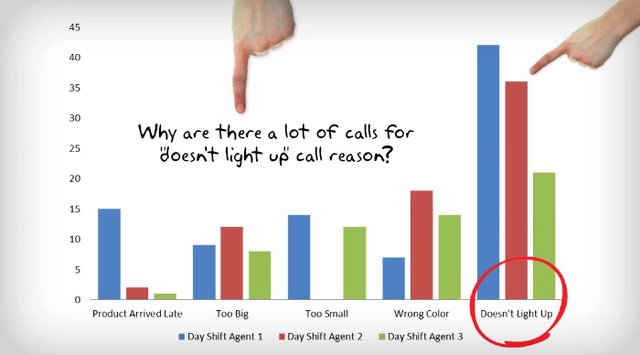
5 Whys Technique in Market Research
The 5 Whys technique, from Taiichi Ohno, is an effective technique traditionally used to arrive at root causes of a problem. But, the method can also

How to Make Resolutions That End in Disaster
The secret to making resolutions end in disaster is also the secret to a really bad movie. So let me teach you about how to make a really bad